


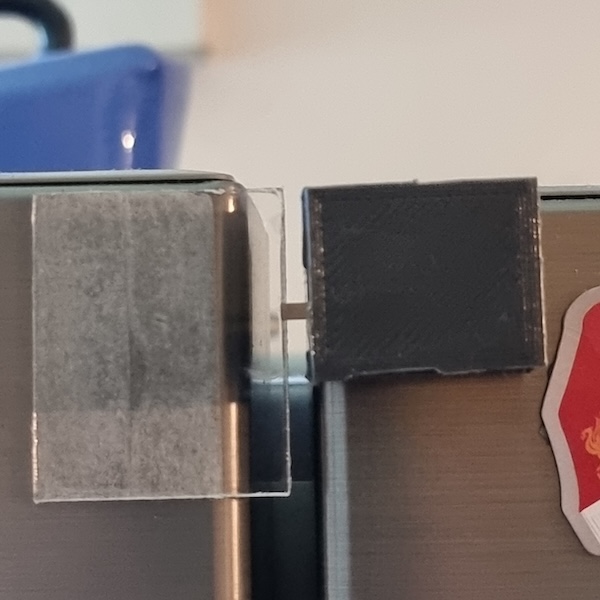
A switch to detect movement of doors & drawers
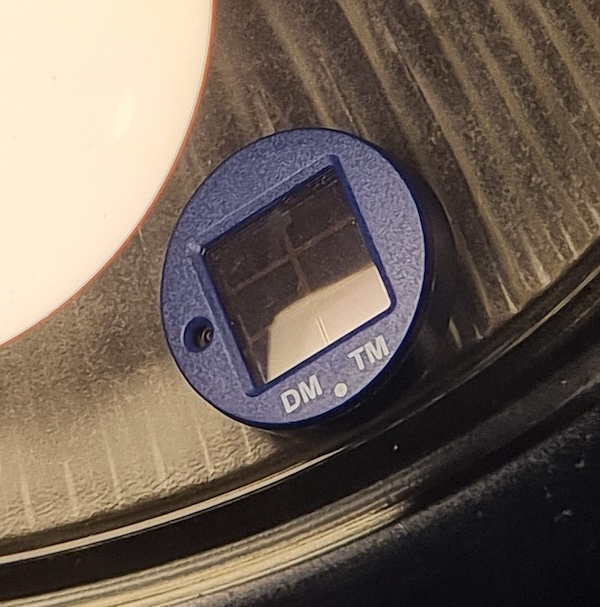
A photocell to detect light
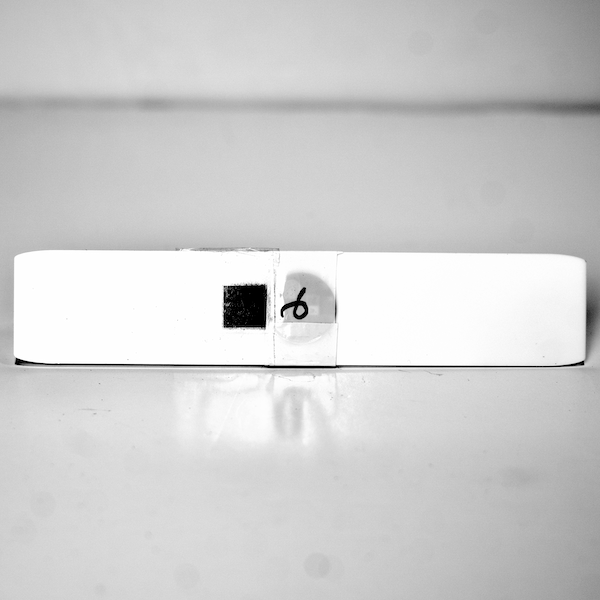
A bookmark with a photocell in to detect a book being opened
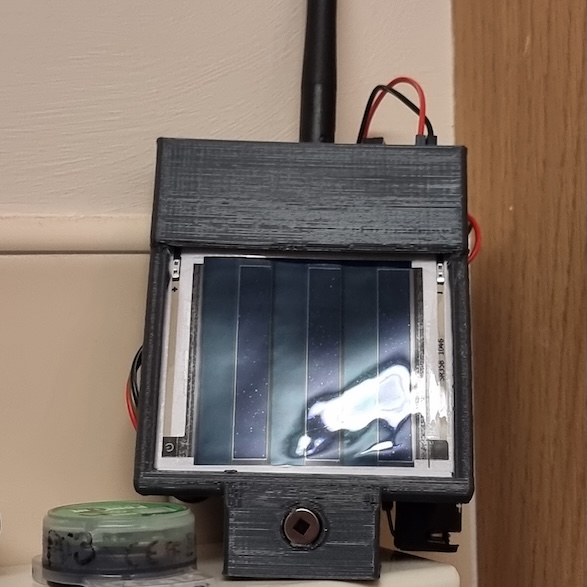
A passive infrared sensor to detect movement
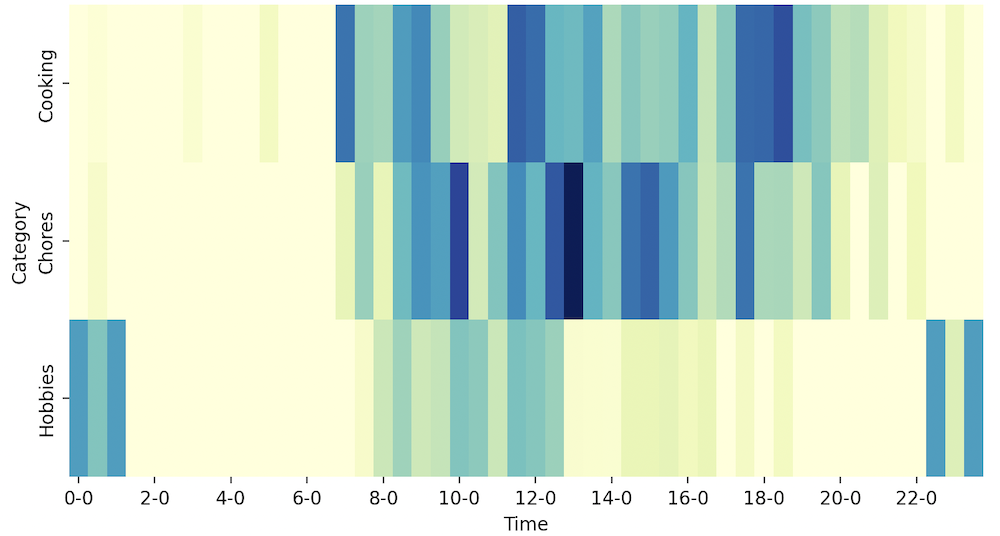
Each sensor was grouped into one of three categories: cooking; chores; hobbies. A heatmap format was used to visualise the data, showing particpants a quick way of understanding when they were most engaged in each of the three categories, as detected by the IoT system.